A saving money chart is more than just a visual tool; it’s a powerful way to track your financial habits and set goals for the future. Whether you’re saving for a new car, a dream vacation, or building an emergency fund, a saving money chart can help you stay on track and motivated. Let’s explore why these charts are so effective, how to create one, and tips for maximizing its impact.
Contents
Why Use a Saving Money Chart?
- Visualization of Progress: Seeing your savings grow over time on a chart can be incredibly motivating. It turns abstract numbers into tangible progress.
- Goal Setting: A saving money chart allows you to set specific financial goals and break them into smaller, manageable milestones.
- Accountability: Tracking your progress ensures you’re holding yourself accountable for meeting your savings targets.
- Flexibility: Whether you’re saving daily, weekly, or monthly, a chart can be customized to suit your schedule and goals.
Types of Saving Money Charts
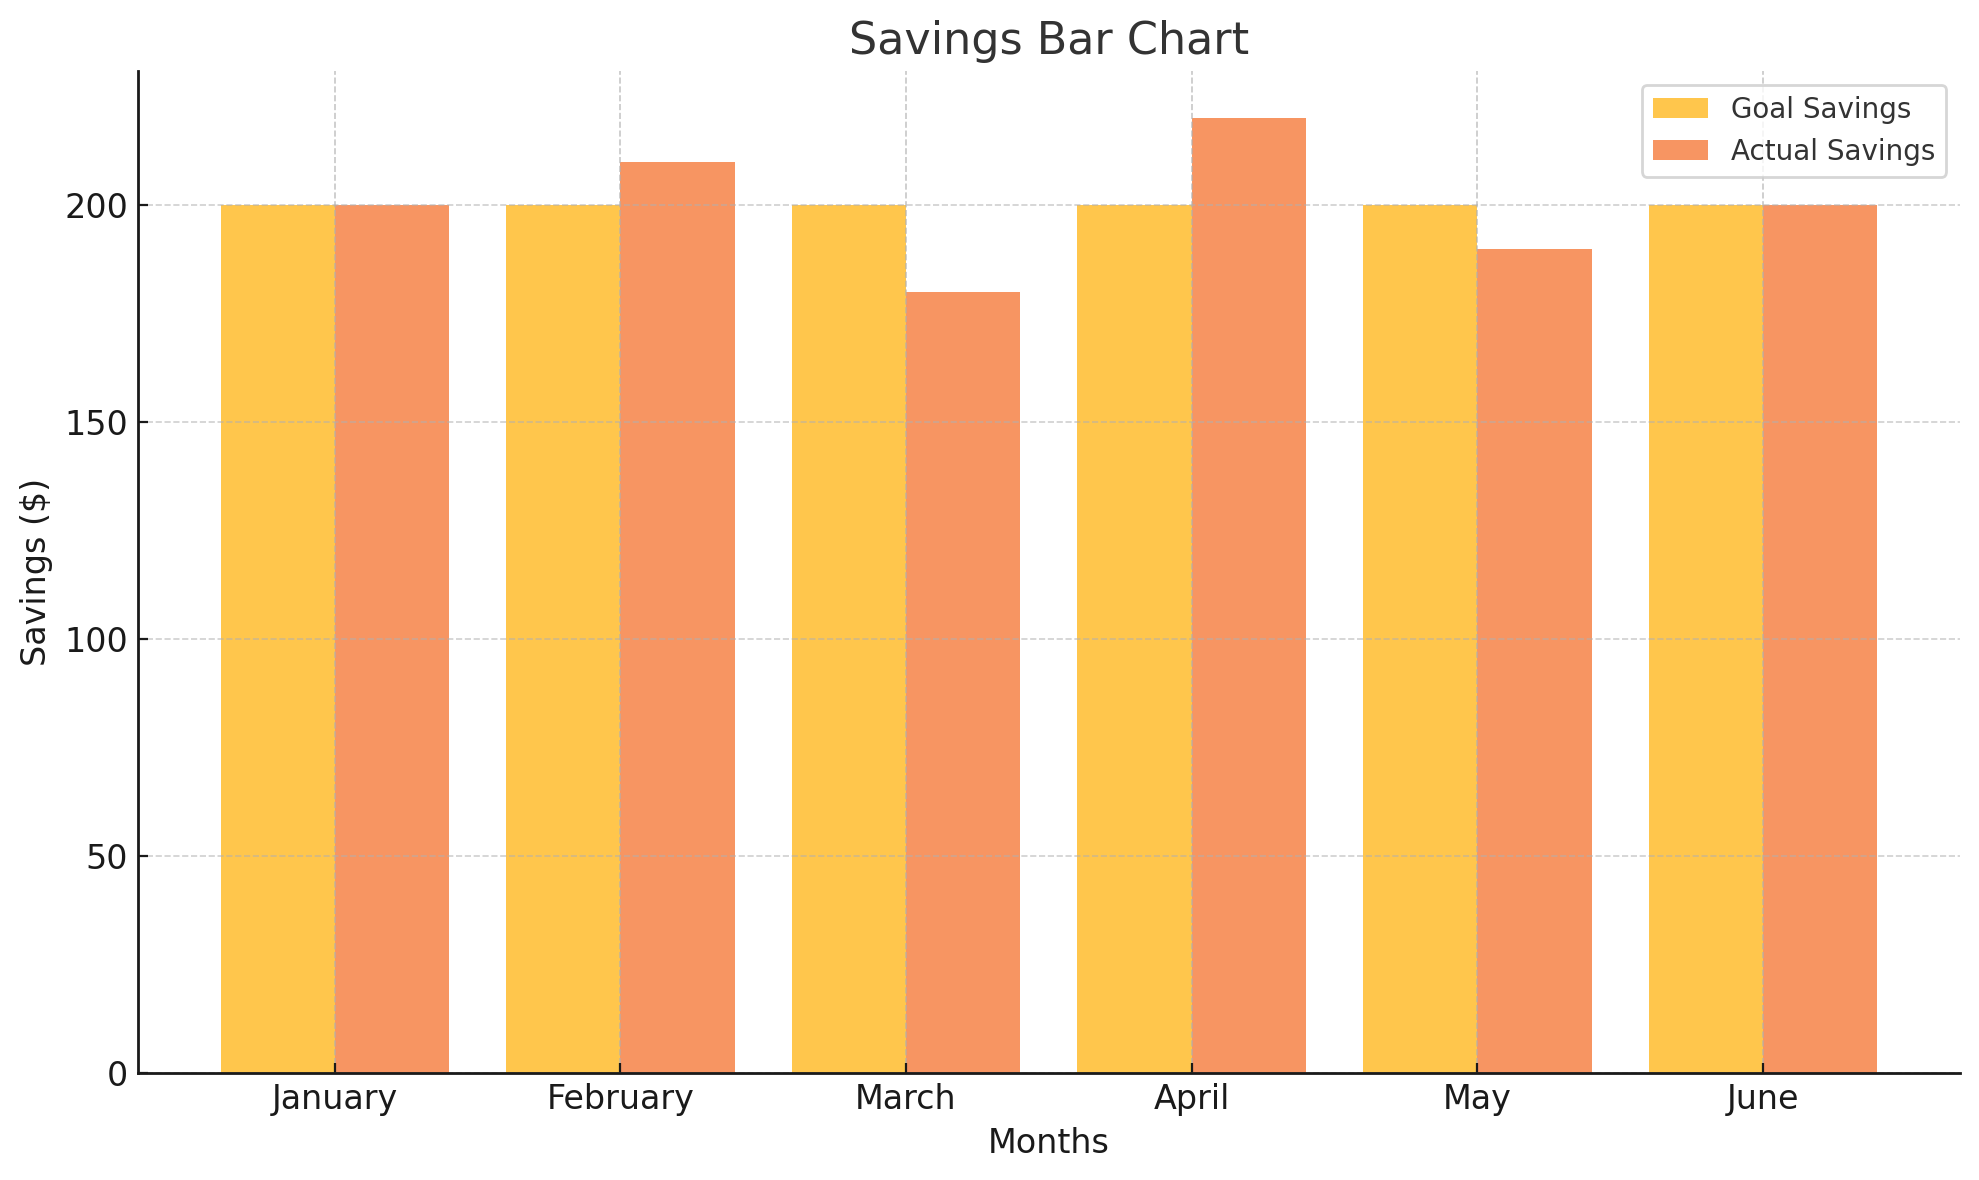
- Bar Chart: Tracks your savings in increments, showing how much you’ve added each period.

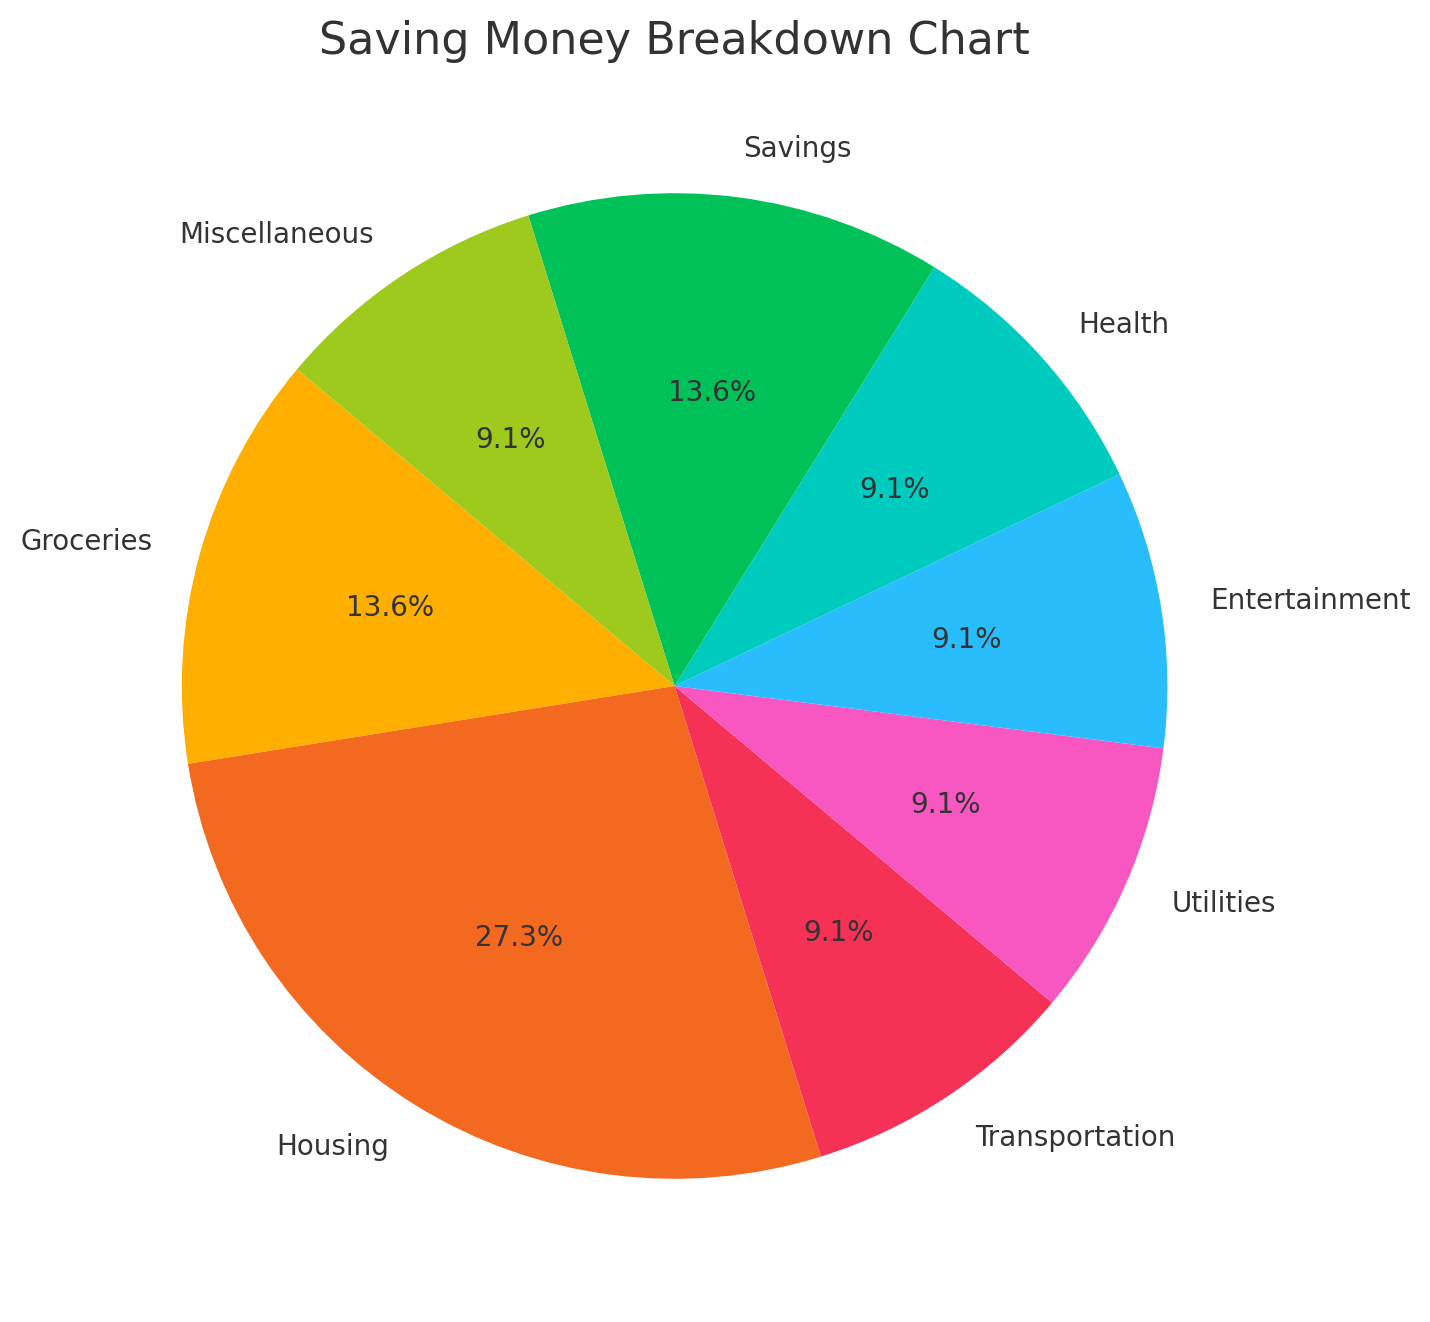
- Pie Chart: Highlights the breakdown of your savings by category, such as emergency fund, travel, or retirement.

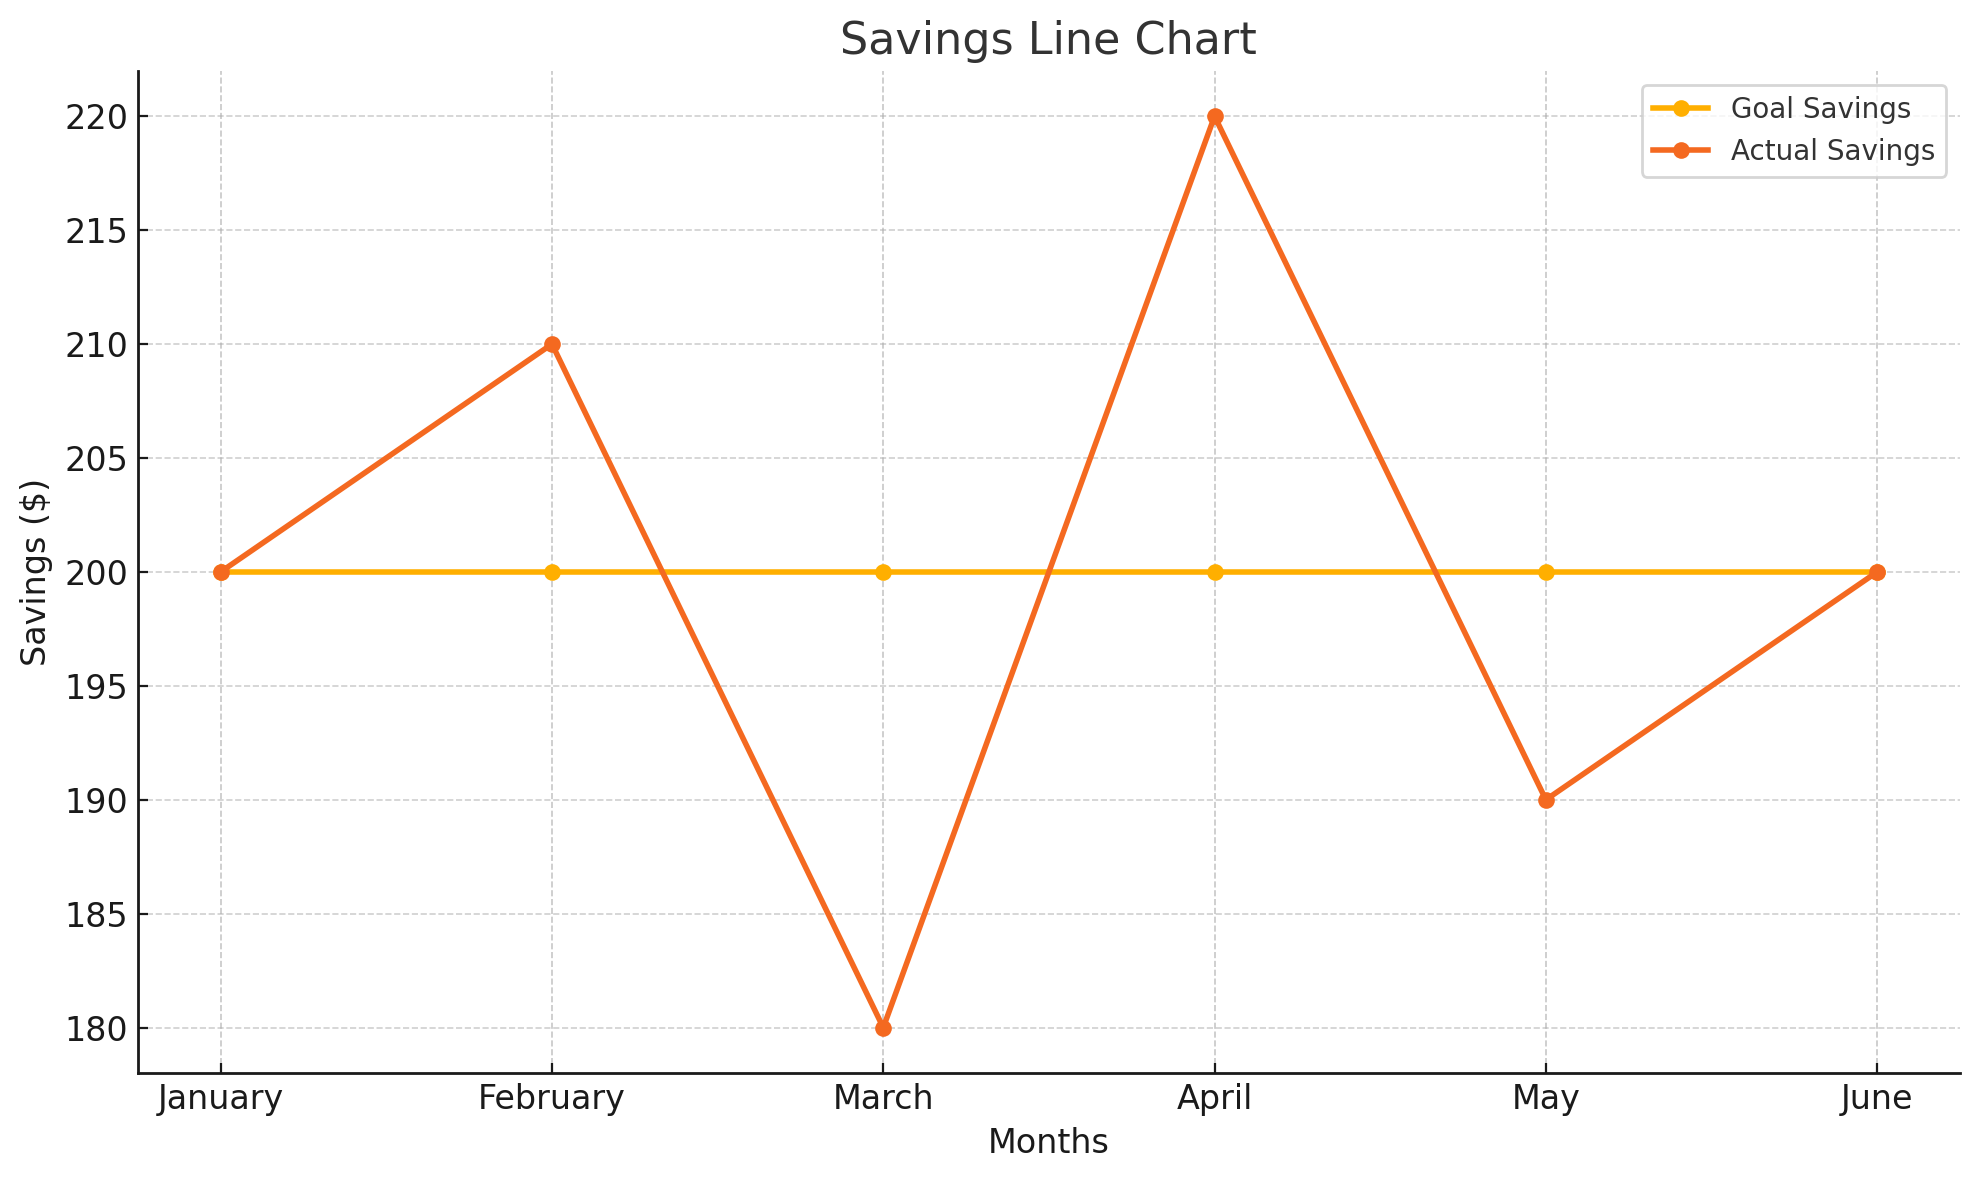
- Line Chart: Displays your savings growth over time, giving you a clear view of your financial trajectory.

- Coloring Chart: Perfect for visual learners, these allow you to color in sections as you reach specific savings goals.
How to Create a Saving Money Chart
- Identify Your Goal: Start with a clear savings target. For example, you might aim to save $5,000 for a new car in one year.
- Choose a Timeframe: Decide how long you want to save and how often you will contribute (daily, weekly, or monthly).
- Select a Format: Choose a chart type that works for you. Many templates are available online, or you can design your own using paper, a spreadsheet, or an app.
- Track Contributions: Regularly update your chart with the amounts you’ve saved. This practice keeps you engaged and aware of your progress.
- Celebrate Milestones: Each time you reach a milestone, take a moment to celebrate. Small rewards can keep you motivated.
Tips for Maximizing Your Saving Money Chart
- Automate Savings: Set up automatic transfers to your savings account to ensure consistency.
- Review Monthly: Take time to review your chart and adjust contributions as needed.
- Use Apps: Consider digital tools that let you create and update charts easily. Apps like Mint or YNAB (You Need a Budget) offer customizable charts and reminders.
- Stay Flexible: Life happens, and financial priorities can shift. If needed, adjust your savings goal or timeline without guilt.
Example of a Saving Money Chart
Let’s say you’re saving $1,200 for a vacation in 6 months. Here’s how your chart might look:
| Month | Goal Savings | Actual Savings |
|---|---|---|
| January | $200 | $200 |
| February | $200 | $210 |
| March | $200 | $180 |
| April | $200 | $220 |
| May | $200 | $190 |
| June | $200 | $200 |
As you track your progress, you can see where you’re on target or need to adjust.
Conclusion
A saving money chart is a simple yet effective tool to help you achieve financial success. By visualizing your progress, setting clear goals, and holding yourself accountable, you can turn your financial dreams into reality. Start creating your own saving money chart today and watch your savings grow!


