Back in 1994, as a young couple with three small children, we qualified for a USDA home loan for first time homebuyers. Our interest rate was 9.99%, and we didn’t bat an eye about it as that was cheap in comparison to any others.
When I built a house in 2008, the interest rate dropped down to 6.99%. And when I swapped houses (not once, but twice), the rates dropped down even further to low as 3.25%.
My daughter and son-in-law were lucky to get locked into a 2% interest rate when buying their house in early 2021. I told them they will never see interest rates that low again in their lifetime.
Now that I’m building a new house again and dreadfully looking at at 7% interest rates. But I’m reminded by looking back at the history of mortgage interest rates that 7% is nothing to bat an eye at again.
Contents
The History Of Mortgage Interest Rates
The history of mortgage interest rates in the United States can be divided into several key periods, reflecting changes in economic policy, inflation, and financial crises.
Post-World War II Era
In the years following World War II, mortgage rates were relatively low, reflecting a period of economic stability and growth. The U.S. government played a significant role in housing finance, leading to accessible mortgage loans.
1970s and Early 1980s – Volatility and High Rates
This period was marked by significant volatility, with rates experiencing dramatic increases. The late 1970s and early 1980s saw some of the highest mortgage rates in history, peaking at over 18% in 1981. This was largely due to high inflation, oil crises, and the Federal Reserve’s policies to combat inflation.
Late 1980s to Early 2000s – Declining Rates
Following the peak, mortgage rates began a gradual decline. This was a period of relative economic stability and low inflation, which contributed to steadily falling rates.
The 2008 Financial Crisis
The housing bubble burst and the subsequent financial crisis led to a sharp drop in interest rates. The Federal Reserve implemented policies to lower rates to stimulate the economy, leading to historically low mortgage rates.
2010s to Early 2020s – Record Lows
Continuing from the financial crisis, this period saw some of the lowest rates on record, further driven down by the Federal Reserve’s policies in response to economic challenges, including the COVID-19 pandemic.
Mortgage Interest Rates History Graph
For a visual representation, below is a graph that outlines the average mortgage interest rates from the 1970s to the present.
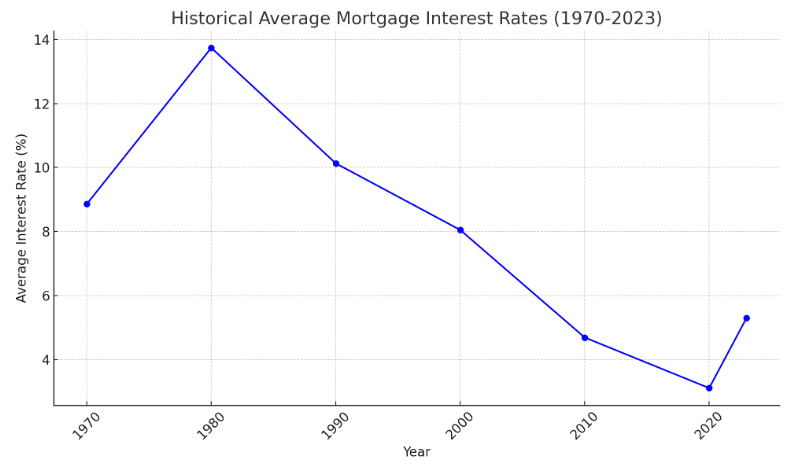
The graph above illustrates the historical average mortgage interest rates from the 1970s through 2023. Here are a few key takeaways:
1970s to Early 1980s
A sharp increase in rates, peaking in the early 1980s. This period was marked by economic volatility and high inflation.
Late 1980s to Early 2000s
A gradual decline in rates, reflecting a period of economic stability and lower inflation.
2008 Financial Crisis
A significant drop in rates as a response to the financial crisis and economic downturn.
2010s to Early 2020s
Rates reached historic lows, especially in the wake of the Federal Reserve’s efforts to combat the economic impacts of the COVID-19 pandemic.
Recent Trends
A slight increase in rates is observed in the most recent data, reflecting changes in economic policy and efforts to combat inflation.
Below is the average mortgage interest rates at every 5-year mark from 1970 through 2020 for a 30-year fixed mortgage in the United States
- 1970: 8.86%
- 1975: 9.05%
- 1980: 13.74%
- 1985: 12.43%
- 1990: 10.13%
- 1995: 7.93%
- 2000: 8.05%
- 2005: 5.87%
- 2010: 4.69%
- 2015: 3.85%
- 2020: 3.11%
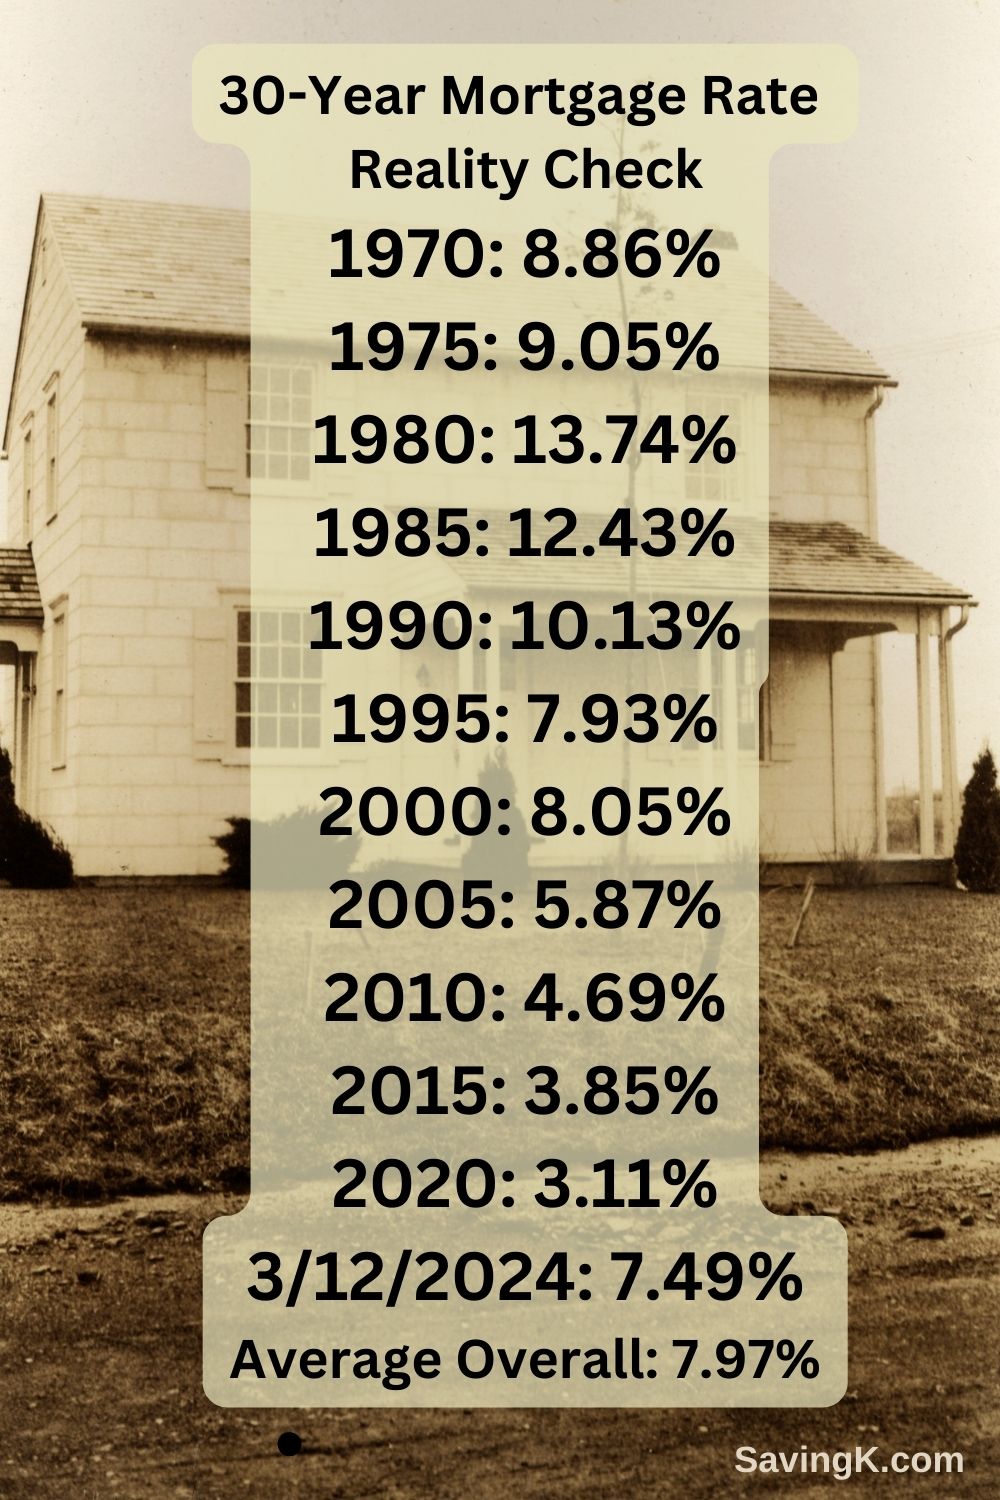
These rates reflect the broader economic trends, policy changes, and market conditions during these periods, illustrating the fluctuating nature of mortgage interest rates over the past 50 years.
The average mortgage interest rate, calculated across all the listed years from 1970 through 2020 at every 5-year mark, is approximately 7.97%. This figure provides a general sense of the long-term average rate for a 30-year fixed mortgage in the United States during this half-century span.
Conclusion
In conclusion, the journey of mortgage interest rates through history is a testament to the complex interplay between economic policies, market forces, and global events. From the post-World War II era’s stability to the volatile periods of the 1970s and early 1980s, followed by a general trend of decline leading into the 21st century, each phase reflects the broader economic environment of its time. The historical lows observed in the 2010s and early 2020s, prompted by efforts to counteract financial crises and stimulate economic growth, highlight the role of monetary policy in shaping the housing market.
Understanding this history is crucial for both prospective homeowners and policymakers. It offers insights into how economic decisions impact the housing market and individuals’ ability to own homes. As we move forward, the lessons learned from past decades can help in crafting policies that aim for stability and affordability in the housing market, ensuring that homeownership remains within reach for future generations. The journey of mortgage interest rates is far from over, but its past offers valuable lessons for navigating the future.

- How To File Your 2025 Income Taxes Online For Free In 2026 - January 26, 2026
- The 12-3-30 Workout And Personal Finance - January 9, 2026
- The Power Of Pop-Up Shops - August 24, 2025